Pay analytics & compensation research

You have the data.
We build the
analysis.

Send us what you already hold. Offers you made, salaries you pay, people who left.

We turn it into a pay structure you can defend, anchored to public official statistics. You see the finished deliverable first. You decide afterwards.

No licensed survey data. Those licences forbid redistribution, so a report built on them cannot show its own working. Ours can.

Why the analysis matters

A raise is only a raise after inflation.

In 2022 a company in Warsaw awarded its team eight percent. Prices rose by 14.4 percent that year. It was a pay cut, delivered in a letter that said congratulations.

Consumer price inflation, 2022 to 2024
Annual percentage change. Source: World Bank, retrieved August 2026.
4% merit budget
8.0
4.1
2.9
7.9
6.8
3.3
14.4
11.5
3.8
United States2022 · 2023 · 2024
United Kingdom2022 · 2023 · 2024
Poland2022 · 2023 · 2024

Everything below the dashed line is a real increase. Everything above it is a real cut. In Poland in 2022 a four percent budget was worth minus 10.4 percent. The four percent line is an illustration, not a published figure. Your own budget, applied to your own locations, is the first thing we compute.

The work

A complete deliverable, not a capability deck.

Three working models you can pull apart right now, then a finished deliverable. Everything here runs on sample figures. The point is what happens when the numbers are yours.

Live models
Move the sliders. The analysis recomputes.
These are the same models we run against client data, stripped back to the controls that matter. Nothing is submitted anywhere.
Country
Year
Merit budget you awarded 4.0%
0.0%
real change in pay
You gave
4.0%
Prices rose
0.0%
Inflation is real data: World Bank, consumer prices, annual percentage change, retrieved August 2026. Real change shown as the simple difference, the convention used in merit planning.

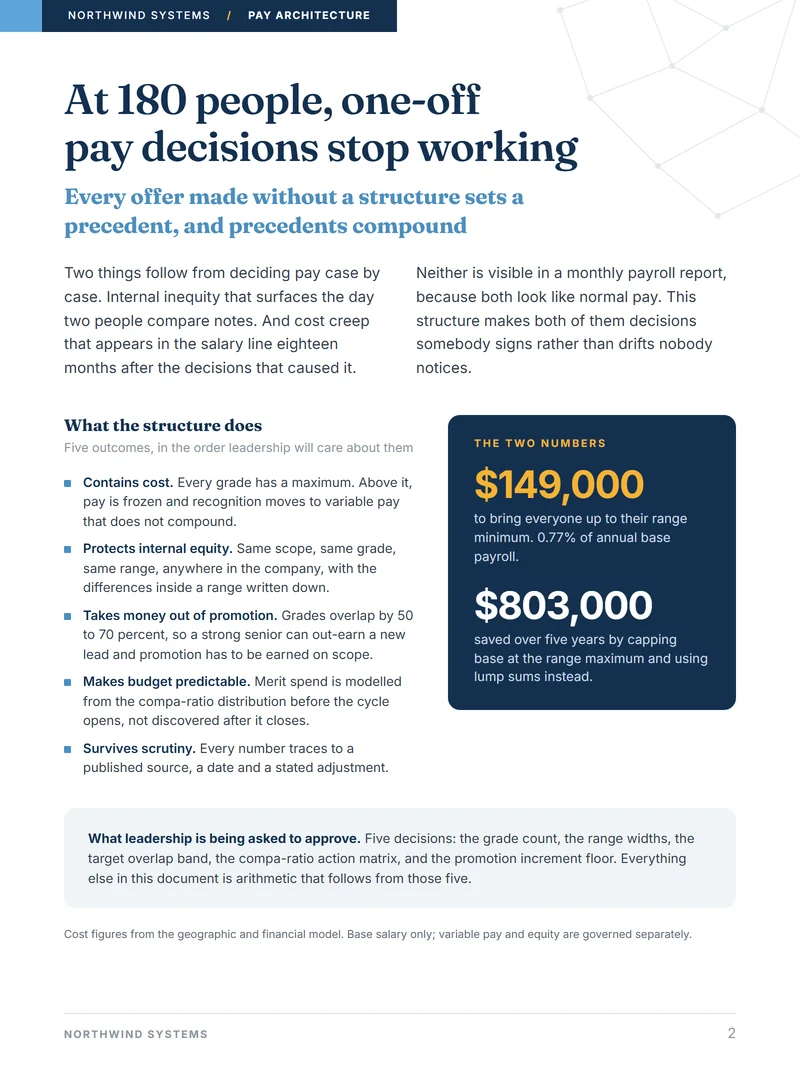
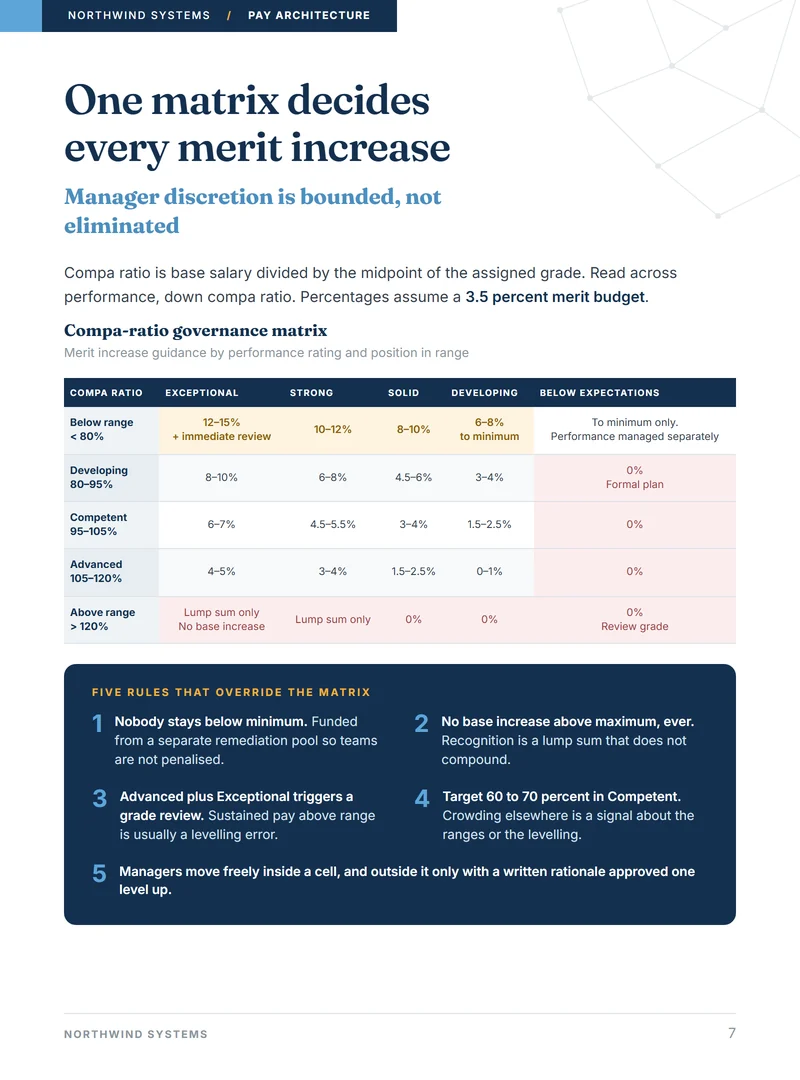
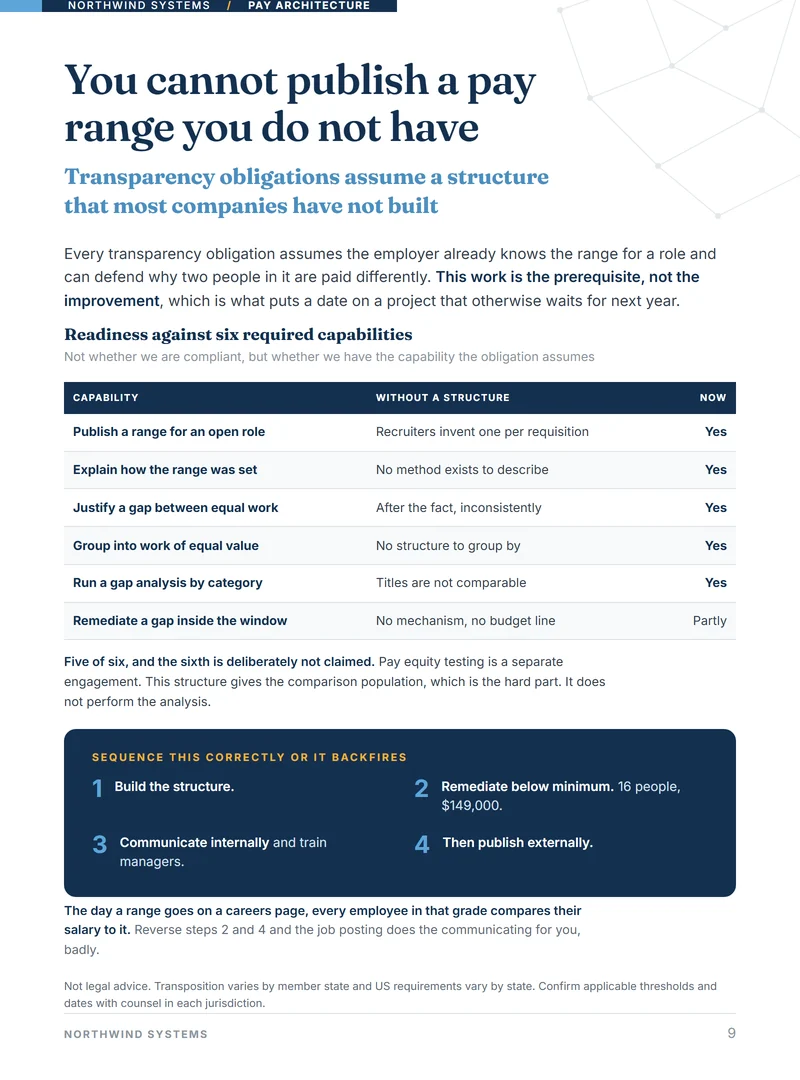
And here is what a finished deliverable looks like. A full pay architecture for a fictional company of 180 people across three countries, sent in full before anyone asks.

Executive summary page showing the cost to bring everyone to range minimum and the saving from capping base pay
The two numbers leadership actually asks about
Compa ratio governance matrix mapping performance rating against position in range
The matrix that replaces negotiation with a rule
Pay transparency readiness assessment across six required capabilities
Readiness, and the one capability we do not claim

If it looks like something you would put your name on, tell us what you are trying to solve. If it does not, no conversation was needed.

The difference

Four things a firm built on proprietary data cannot do.

None of these are claims about working harder. They are structural, and they are the reason this practice exists.

01
We publish the method
A firm whose advantage is a licensed dataset cannot show you how a number was made without destroying the asset it sells. Ours is public, so the derivation ships with the work. Every source named, every adjustment stated, every date recorded.
02
We work under your name
White label by default. Your logo, your foreword, your client relationship. We have no interest in being visible to the people you serve, which is exactly why firms that publish their own research use us.
03
We tell you what we did not assess
Every deliverable carries a limits page. Pay equity testing, individual placement, statutory compliance, all named as out of scope rather than quietly implied as covered. Clients tell us it is the page they read first.
04
You see the work before you commit
We build the analysis on your data and show you the finished deliverable. Then you decide whether there is a conversation to have. Nobody is asked to buy a description of something.

What we build

Four things, done properly.

01 · Pay architecture

Salary bands and job levelling

Grades, ranges, midpoint progression and overlap. A compa ratio matrix so managers apply a rule instead of negotiating. Level descriptors that settle a promotion argument in writing. Geographic differentials that move the whole range, so a promotion means the same thing in every country.

Built from your payroll, offer and attrition data
02 · Research

White label reports and salary guides

The annual guide your firm publishes, produced for you. Built on public official statistics with the derivation documented well enough that a sceptical reader can check it, which is what makes a prospect forward it internally rather than skim it.

Your brand on the cover, no attribution to us
03 · Readiness

Pay transparency preparation

You cannot publish a pay range you do not have. We build the structure that makes disclosure possible, quantify what it costs to bring everyone above their range minimum, and sequence the rollout so a job posting is not what tells your team.

Includes the remediation cost, computed on your headcount
04 · Communication

The explainer employees actually read

Most companies build a structure and never explain it, so nobody believes it. We write the plain language piece that answers the eight questions people really ask, including the awkward ones about why a colleague earns more.

Written to be handed straight to your whole company

The method

Your data, anchored to public statistics.

Five steps. Each one is recorded in the deliverable, so any figure can be traced back to a source, a date and a stated adjustment.

STEP 01
Anchor
BLS Occupational Employment Statistics, ONS Annual Survey of Hours and Earnings, Eurostat, national statistics offices. Industry cuts, never national averages.
STEP 02
Age
Public wage data is always stale. We age it using the Employment Cost Index, never headline CPI, which is the most common analytical error in this work.
STEP 03
Level weight
Grades mapped to percentiles of the adjusted distribution, interpolated log linearly because wage distributions are skewed to the right.
STEP 04
Blend
Your offers made, accepted and declined. Your attrition. Weighted by how much evidence there actually is, not by preference.
STEP 05
Publish
Sources with retrieval dates, adjustments applied, assumptions written down, and an explicit list of what was not assessed.

Step 04, in plain terms

0 half all 10 30 60 120 offers and exits you can give us
  • Five Your data is an anecdote. The public figures do nearly all of the work.
  • Thirty Equal footing. Your evidence and the published statistics carry the same weight.
  • Sixty Your data decides. The public anchor becomes a check on it.
  • A hundred The market you actually compete in is now visible, and it is rarely the market the averages describe.

This is what keeps the work honest in both directions. It stops six data points being treated as truth, and it stops sixty being ignored because a published table felt more official. If your sample is thin we say so, and the structure is marked provisional.

Who we work with

Firms that publish, and firms that are scaling.

Executive search firms

You publish an annual salary guide because your market expects it. We produce it, under your name, so your researchers can stay on searches.

HR and reward consultancies

Capacity is the bottleneck, not demand. We are the production layer behind band structures and job architecture your clients never see us build.

HR technology vendors

The State of Compensation report your category expects. Built so a prospect can check it, which is what makes it travel.

Companies of 80 to 400

The size where pay decisions stop scaling one at a time and every offer quietly becomes a precedent.

Get in touch

Tell us what you are trying to defend.

A headcount, a function and the countries involved is enough to begin. We will tell you before you commit whether we are the right people for it, and if we are not, we will say so.